24h long-run · Drizzle · us-east-1 · pooler
Neon vs Supabase on Stack Overflow-scale Postgres
Performance and monthly cost for the same Drizzle workloads on  Neon and
 Supabase — identical ~5.1 GB data restored with
 pg_restore, with no extra tuning beyond the dump.
Postgres performance below is response time (ms) per query at the p50 (median) andp99 percentiles, computed from everysuiterow in the 24-hour long-run set of suites (one suite = one full pass of all read-only Drizzle queryset). Lower is faster.
Dataset
Benchmarks run against theStack Overflow sample database for Postgresdistributed bySmart Postgres. The dump is derived from the official Stack Overflow data dump (CC BY-SA 4.0); when you use it, attribute the data toStack Overflow as described in that license.
These runs use thesmallSmart Postgres release (roughly the first three years of Stack Overflow). We only downloaded and restored it withpg_restoreinto Postgres (~5.1 GBon disk afterward). No further optimization on Neon or Supabase was made. Core tables includeusers,posts,comments,votes, andbadges(millions of rows at full scale).
These numbers are read-only Drizzle queries overpublic (findMany, findFirst, nested reads, aggregates, and related patterns on posts, users, comments, votes, and tags).
Test setup
Both Neon and Supabase projects were created inAWS us-east-1(N. Virginia). The benchmark worker ran on anEC2 instance in us-east-1so compute and databases share the same region.
All traffic used each provider’spoolerconnection string (not a direct Postgres host) - the URLs inNEON_URLandSUPABASE_URLtargeted Neon’s pooler and Supabase Supavisor respectively, with a single client connection per worker.
Benchmark run window
| Provider | Started (UTC) | Ended (UTC) |
|---|---|---|
| Neon | 2026-05-20 16:31:14 UTC | 2026-05-21 16:31:23 UTC |
| Supabase | 2026-05-20 16:31:14 UTC | 2026-05-21 16:31:17 UTC |
From worker_started/worker_finished in benchlr-env-neon.csv and benchlr-env-supabase.csv.
Schedule:4 cycles x (5 h continuous Drizzle suites + 1 h cold idle), ~24 h total. Last suite before the final idle hour:2026-05-21 15:31:23 UTC. Derived from results/long-run-1779294672020/ logs and CSV markers.
Branch creation time
3 parallel branch creates per provider; mean time until SELECT 1succeeds on the branch connection string. Lower is faster. Measured 2026-06-03 09:12:07 UTC (poll every 50 ms).
| Metric | Supabase | Neon |
|---|---|---|
| Mean time to queryable (SELECT 1) | 5.09 s | 1.84 s |
Source: npm run branch-create → results-website/branch-create.json. Regenerate after re-running the benchmark.
PITR restore time
Point-in-time restore to the latest backup window; timer starts at the restore API POST and ends when public.badgesis present (Postgres connection only). Lower is faster. Measured 2026-06-03 12:29:08 UTC (poll 100 ms).
| Metric | Supabase | Neon |
|---|---|---|
| Time to restore (Postgres connection + table present after restore POST) | 72.62 s | 5.79 s |
Source: npm run pitr → results-website/pitr.json. Regenerate after re-running the benchmark.
Memory & compute during the run
Console screenshots from the same ~24 h window as the benchmark. Neon and Supabase report memory differently (compute units vs. VM totals), but both charts line up with the four 5 h work blocks and 1 h cold-idle gaps in the run schedule.
| During the run | Neon | Supabase |
|---|---|---|
| RAM while querying | ~0.6 GB used, ~1.8–2 GB used + cached | 7.55 GB on an ~8 GB instance; almost all in cache + buffers, thin active used slice |
| 1 h cold idle (between cycles) | Endpoint inactive — RAM and CPU drop to zero (autosuspend after 5 min) | Memory stays at 7.55 GB; VM remains provisioned |
| Compute shape | 0.25–8 CU autoscale; min ~1 GB / max ~32 GB RAM at ceiling | ~8 GB fixed instance with 2-core ARM CPU; no scale-to-zero or autosuspend |
| CPU while querying | ~0.25 vCPU used at minimum; allocated spikes to ~1.5 vCPU | ~0.86% CPU used (~99% idle) |
Takeaway: Neon’s footprint shrinks between benchmark cycles because the endpoint suspends; Supabase keeps a large, warm buffer pool for the full day.
Neon - RAM & CPU (console)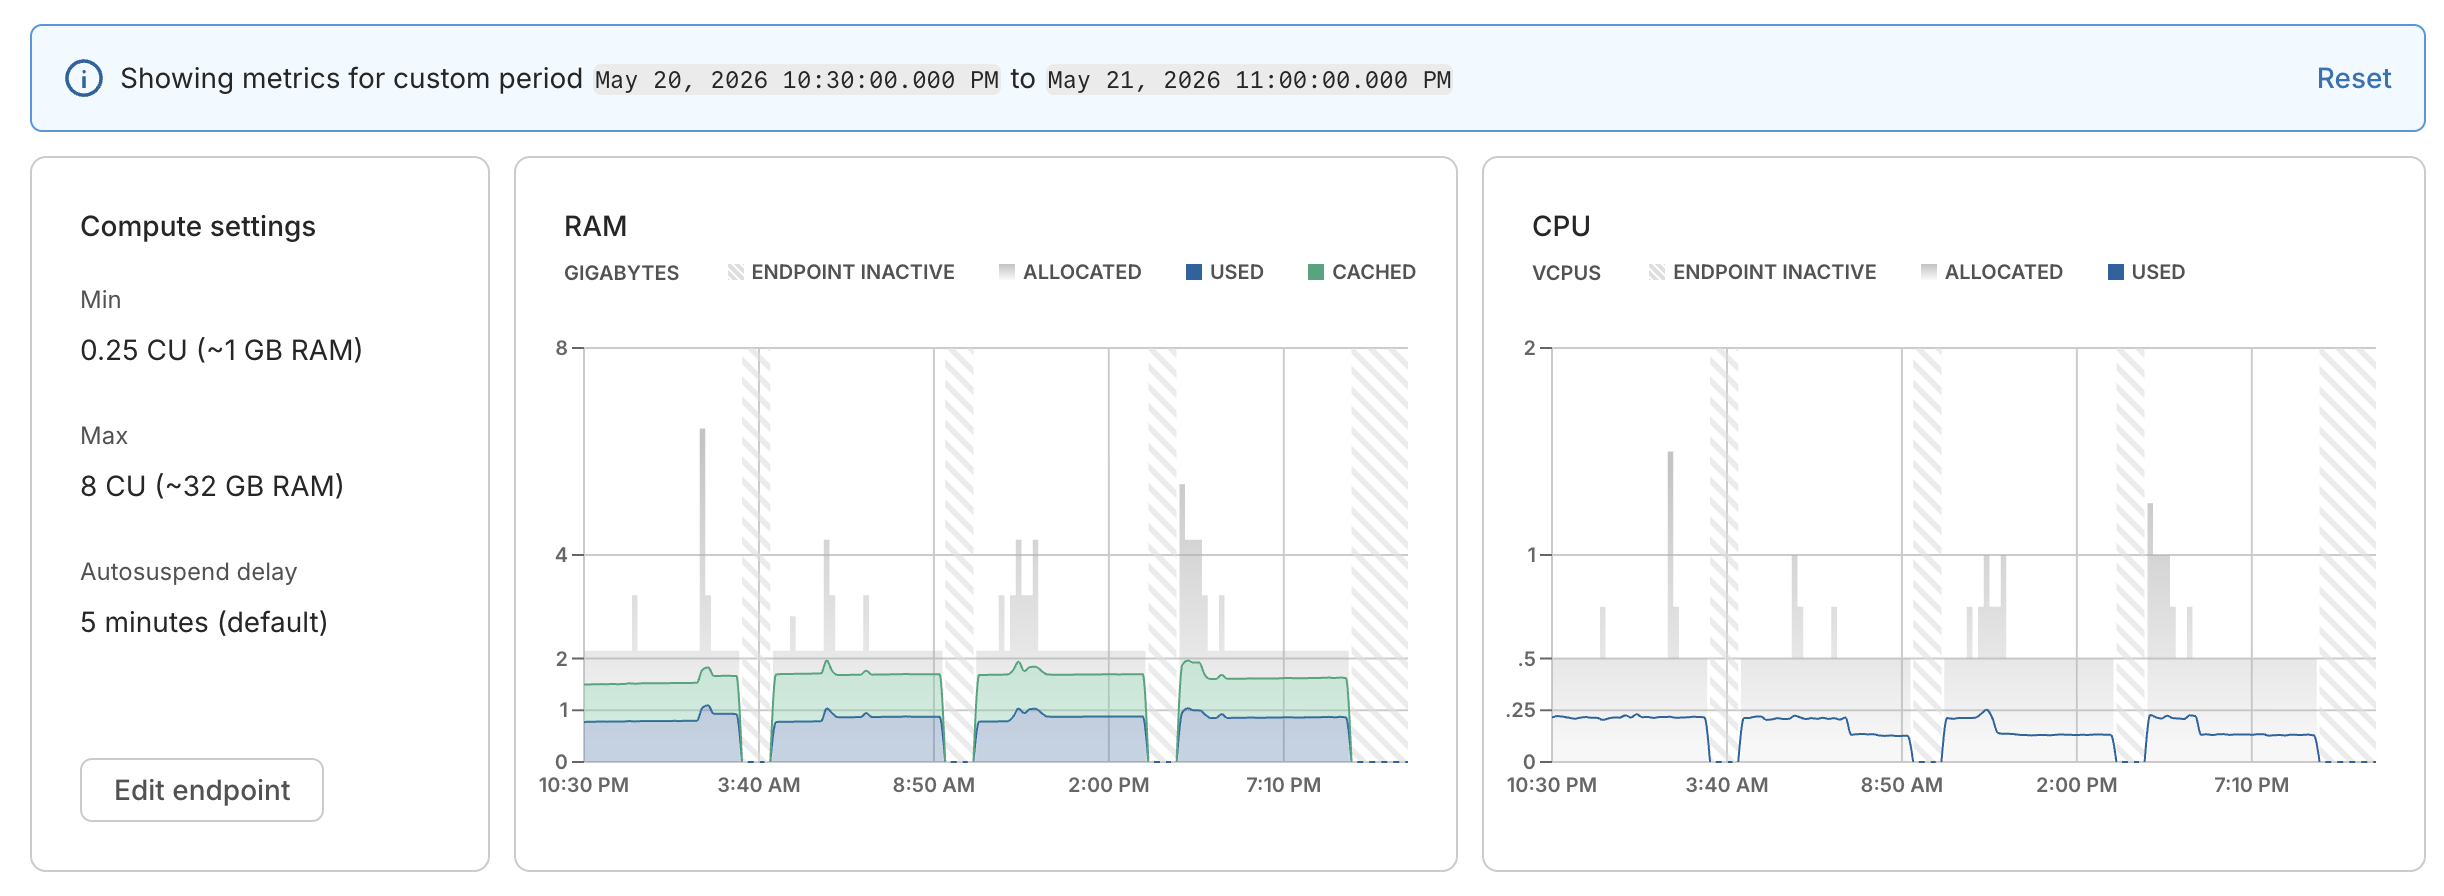
Four active blocks match benchmark work cycles; hatched gaps are autosuspend. ~0.6 GB used and ~1.8–2 GB cached while active; allocated RAM spikes to ~7 GB.
Supabase - Memory usage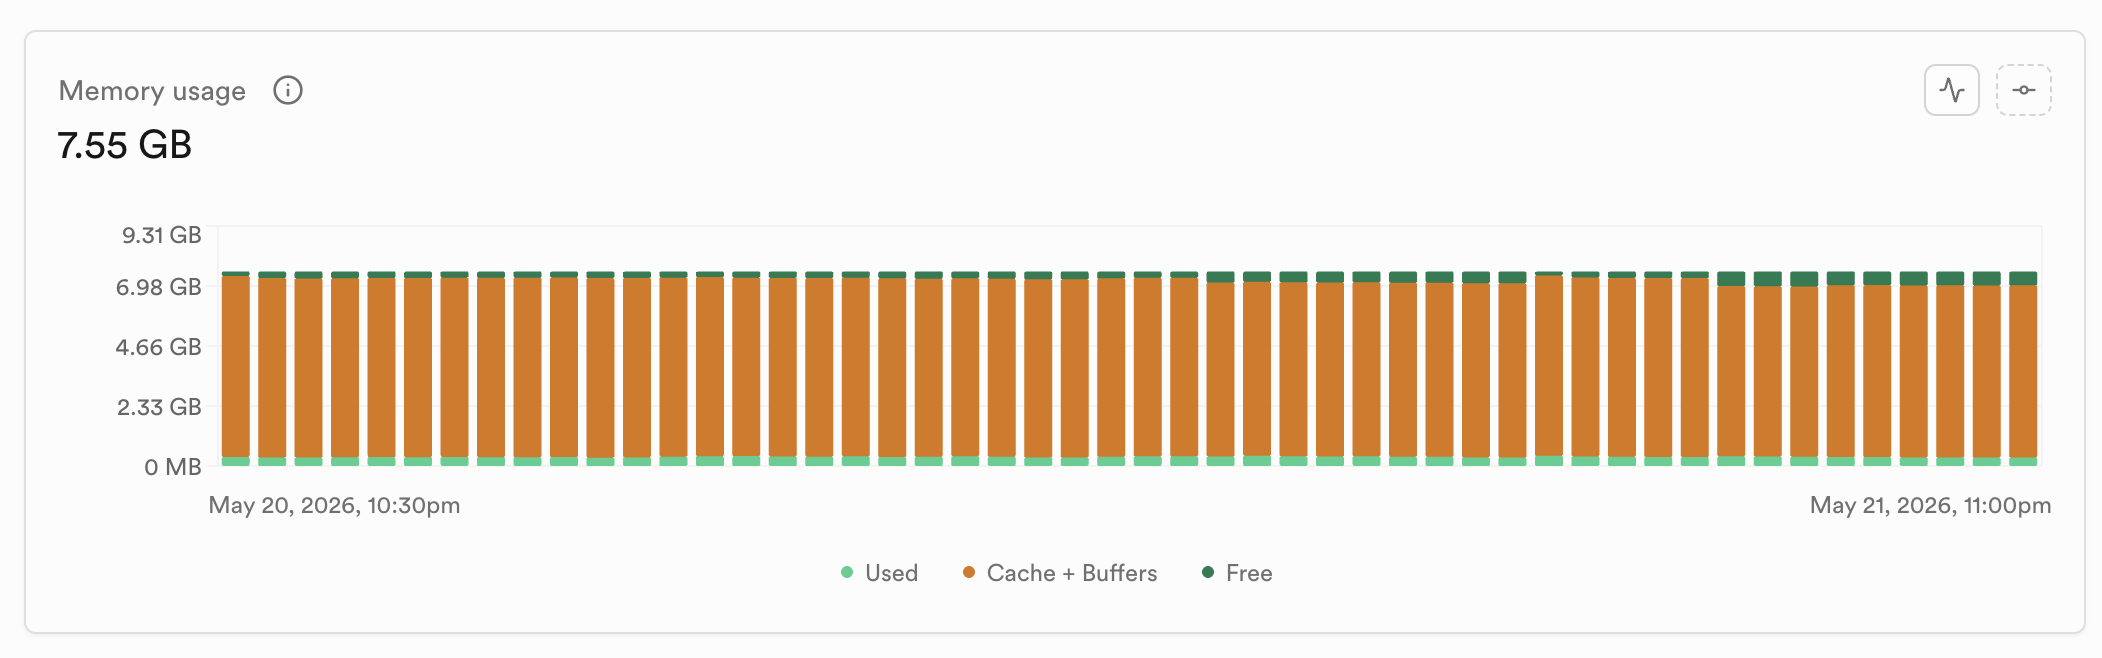
Flat 7.55 GB cache+buffers for the full 24 h — no drop during cold-idle hours between Drizzle suites.
Supabase - CPU & network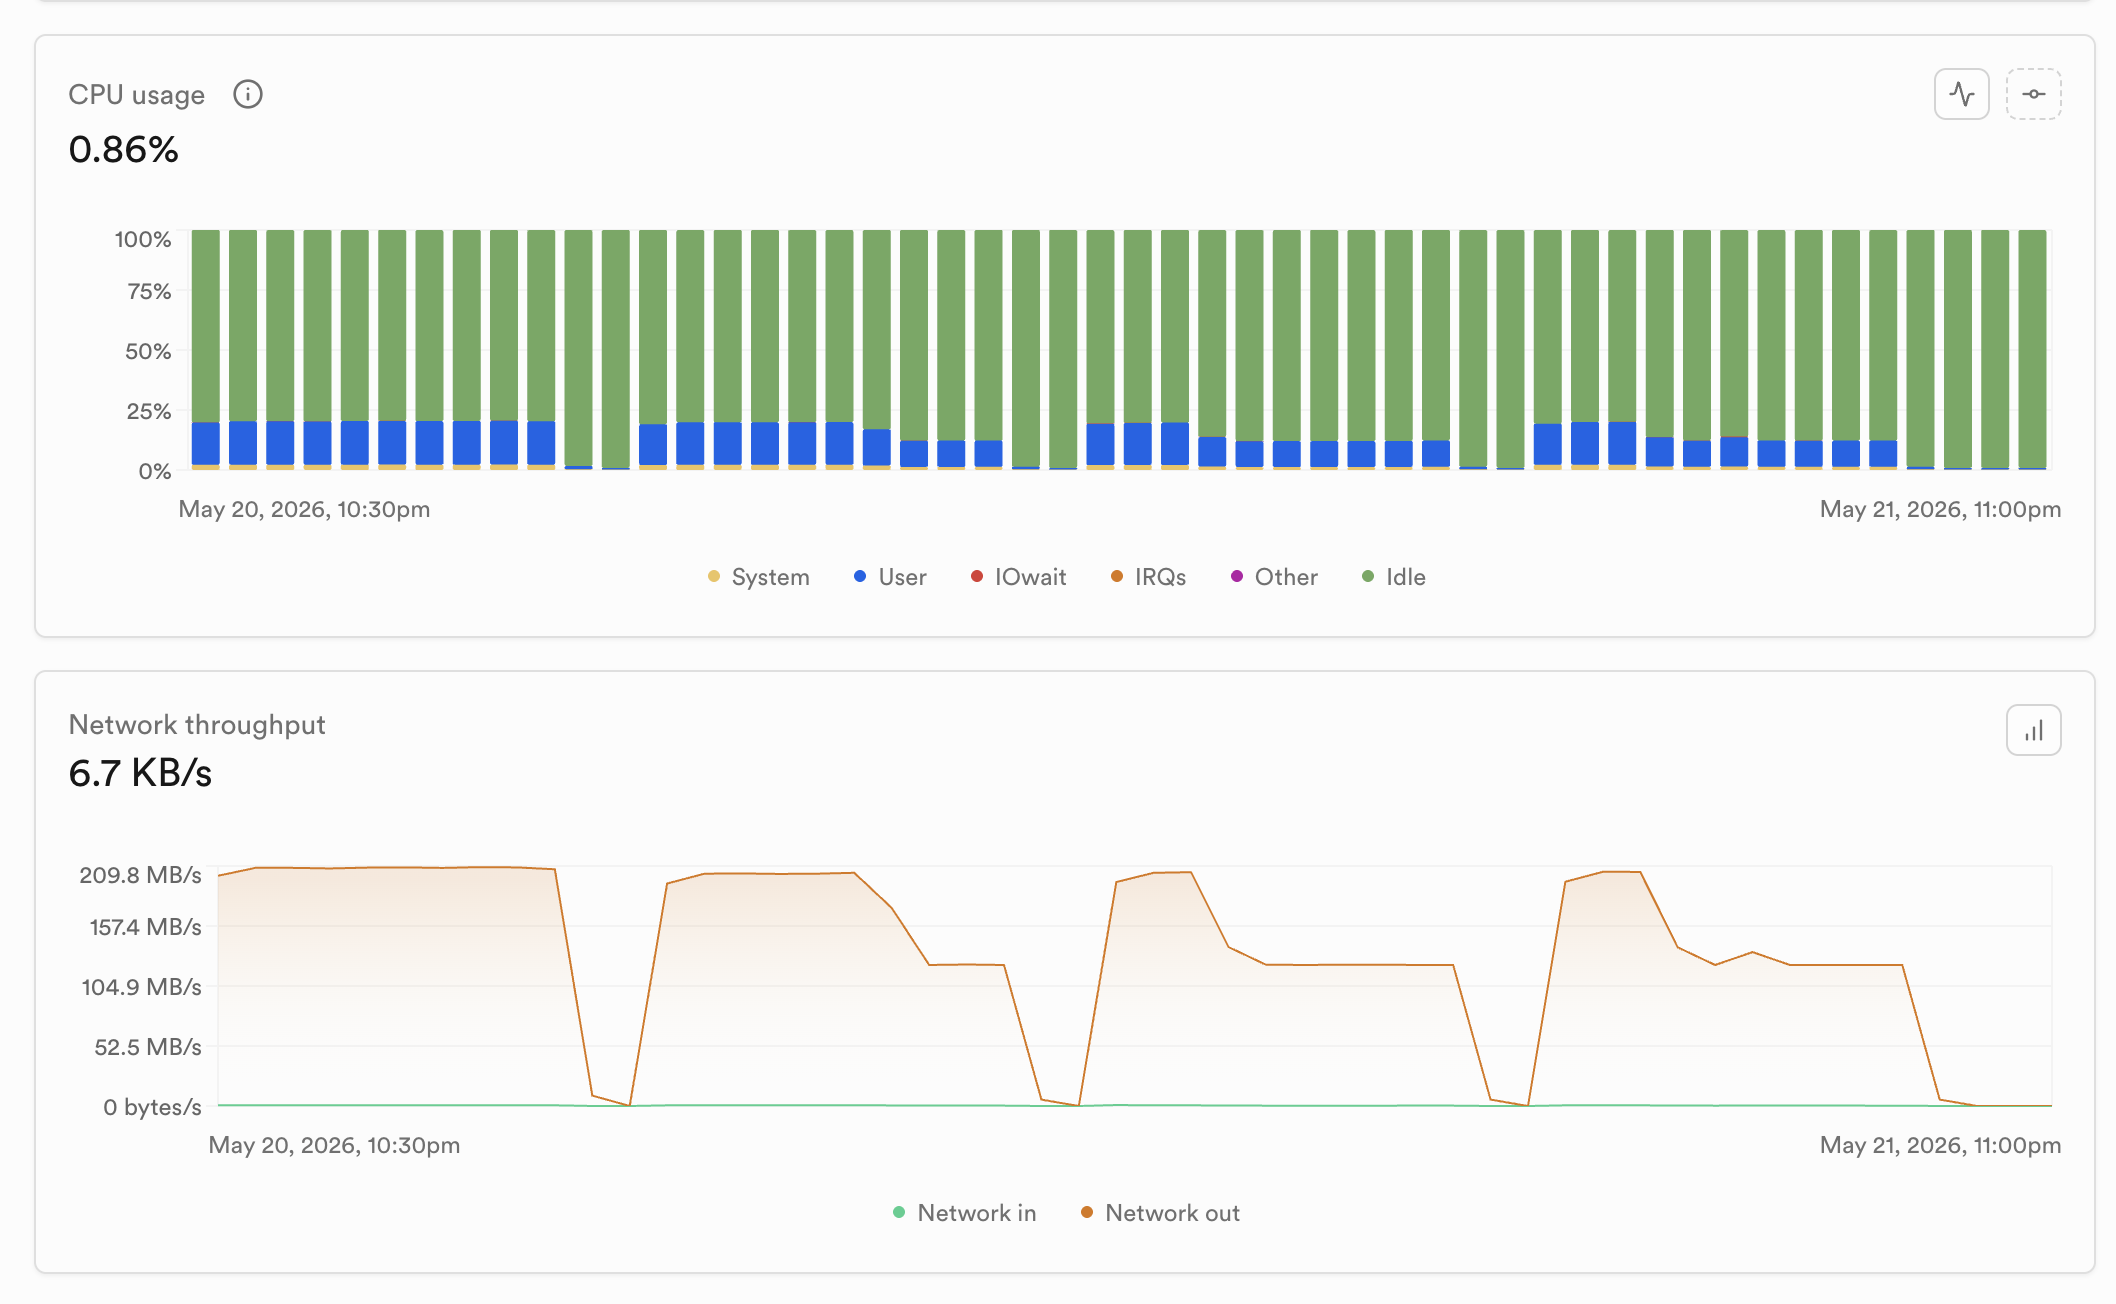
Four outbound bursts peak ~210 MB/s and hold ~110 MB/s during work blocks; CPU stays ~0.86% used (~99% idle).
Postgres performance (p50 & p99 ms)
| Name | Supabase | Neon | ||
|---|---|---|---|---|
| p50 | p99 | p50 | p99 | |
| find allDrizzleusers.findMany({ limit: 5000 }) — SELECT up to 5,000 rows from public.users. | 112.74 | 259.28 | 150.35 | 294.58 |
| find all filter paginate orderDrizzleusers.findMany({ where: reputation > 0, orderBy: creationdate DESC, offset: 0, limit: 10 }) — filtered, sorted page of users. | 3.67 | 20.80 | 4.47 | 21.38 |
| find all 1-level nestingDrizzleusers.findMany({ with: { posts: true }, limit: 200 }) — users plus related posts in one relational query. | 544.44 | 1131.19 | 528.35 | 1037.47 |
| find firstDrizzleusers.findFirst() — single user row (no explicit WHERE). | 5.57 | 37.93 | 3.88 | 38.48 |
| find first 1-level nestingDrizzleusers.findFirst({ with: { posts: true } }) — one user with nested posts. | 5.55 | 20.62 | 4.95 | 35.89 |
| find uniqueDrizzleusers.findFirst({ where: id = 1 }) — point lookup on users.id = 1 (labeled “find unique” in the suite). | 2.99 | 13.52 | 2.68 | 14.52 |
| find unique 1-level nestingDrizzleusers.findFirst({ where: id = 1, with: { posts: true } }) — user id = 1 with nested posts. | 9.77 | 39.51 | 8.96 | 51.13 |
| posts find allDrizzleposts.findMany({ limit: 50 }) — up to 50 rows from public.posts. | 5.11 | 20.00 | 5.17 | 28.56 |
| posts find all with commentsDrizzleposts.findMany({ with: { comments: true }, limit: 10 }) — posts with nested comments. | 4.68 | 19.87 | 4.36 | 23.00 |
| comments find first with postDrizzlecomments.findFirst({ with: { post: true } }) — one comment row with its parent post. | 3.94 | 18.06 | 3.65 | 19.08 |
| votes find allDrizzlevotes.findMany({ limit: 100 }) — up to 100 rows from public.votes. | 3.39 | 15.83 | 3.49 | 17.36 |
| tags find all | 3.44 | 15.20 | 3.61 | 18.52 |
| badges find all with userDrizzlebadges.findMany({ with: { user: true }, limit: 50 }) — badges with nested user. | 5.11 | 19.90 | 4.86 | 20.96 |
| readonly transactionDrizzledb.transaction (read-only): findFirst on users, then findFirst on posts — two reads in one transaction. | 12.12 | 33.21 | 11.31 | 34.07 |
Monthly cost comparison
Monthly cost estimates for running this benchmark’s ~5 GB Postgres dataset on each provider’s production configuration. Neon bills usage (CU-hours + storage); Supabase bills a fixed Pro + Largeinstance with custom disk for WAL and system overhead.Neon breakdownandSupabase breakdownbelow for full assumptions and line-item math.
| Setup | Neon | Supabase |
|---|---|---|
| Plan | Scale — $0.22/CU-hr, $0.35/GB-month | Pro — $25.00/mo (8 GB disk included) |
| Storage / disk | 5.1 GB data, metered monthly | 5.1 GB DB + 3.86 GB WAL + 1.51 GB system ≈ 10.47 GB → 12 GB custom disk (over Pro limit) |
| Compute | 0.25–8 CU autoscale; ~0.5 CU avg in work blocks | Large — 8 GB RAM (4 GB tier not enough for ~5.1 GB DB in memory); $0.15/hr |
| Benchmark schedule | 4× (5 h on + 1 h idle) → 20 h compute / day, 4 h suspended (0 CU-hr) | VM stays on 24/7 — cost does not follow the 5 h / 1 h cycle |
| Monthly line item | Neon | Supabase |
|---|---|---|
| Storage | 5.1 GB × $0.35 = $1.78 | Included in Pro + 12 GB disk sizing |
| Compute | 304.38 CU-hr × $0.22 = $67.57 | $110.00 (Large add-on) |
| Plan / credits | — | $25.00 − $10.00 credits |
| Estimated total | $69.35/mo | $125.00/mo |
Egress and extra disk charges are not included. For this workload, Neon is roughly 2× cheaper at the central estimate ($69.35 vs$125.00).
What each plan includes beyond Postgres compute
This benchmark only exercised Drizzle reads over the pooler, but both production plans bundle more than raw database hosting.Neon Scale ($0.22/CU-hr, $0.35/GB-month) is Postgres-first with enterprise ops.Supabase Pro ($25.00/mo) adds a full backend platform on top of the Large compute add-on used here.
| Included on the plan | NeonScale | SupabasePro |
|---|---|---|
| Postgres core | Serverless Postgres, branching, read replicas, connection pooling, extensions, Data API | Dedicated Postgres, unlimited API requests, Supavisor pooler, 7-day automatic backups |
| Recovery | Up to 30-day history window; 100 snapshots; daily/weekly/monthly scheduled backups | 7-day automatic backups; point-in-time recovery optional ($100/mo per 7 days) |
| Auth | Up to 1M MAU included (MFA coming soon) | 100k MAU; OAuth, custom SMTP, basic MFA, SAML (50 MAU), auth hooks, 7-day audit logs |
| Storage & files | Object storage that branches with your database in early access as of 6/1/2026 | 100 GB object storage; Smart CDN; 50 GB max upload; 100 origin images for transforms |
| Realtime & edge | — | Realtime Postgres Changes; 500 concurrent connections; 5M messages/mo; 2M Edge Function invocations |
| Network | 500 GB egress included; IP Allow rules; Private Link ($0.01/GB private transfer) | 250 GB egress + 250 GB cached egress included; AWS PrivateLink |
| Observability | 14-day monitoring retention; metrics/logs export (Datadog, OTel); spending limits | 7-day API & database log retention; metrics endpoint; platform audit logs |
| Compliance & support | SOC 2 report access; HIPAA available; uptime SLA; Standard+ support tiers | SOC 2 & ISO 27001; email support; vanity URLs; spend caps on by default |
Takeaway: Neon Scale extras skew toward production Postgres (longer PITR, compliance, private networking, scale-to-zero billing). Supabase Pro extras include Auth, Storage, Realtime, and Edge Functions — a wider app platform bundled with the Pro subscription, even when the workload is Postgres-only.
Neon— Scale plan detail
Back to comparison
Neon— Scale plan detailExtrapolating this benchmark’s schedule to a full month on Neon’sScaleplan ($0.22/CU-hr compute, $0.35/GB-month storage). Compute is billed asaverage CU × hours the endpoint runs; autosuspend during each 1 h cold-idle block means0 CU-hourswhile the endpoint is inactive.
| Assumption | Value |
|---|---|
| Daily schedule | 4× (5 h Drizzle suites + 1 h cold idle) = 20 h compute on, 4 h suspended |
| Compute size | 0.25–8 CU autoscale; ~0.5 CU average during work blocks (from console RAM/CPU) |
| Storage | 5.1 GB maintained all month |
| Active hours / month | (20 / 24) × 730.5 ≈ 608.75 h |
| Line item | Calculation | Monthly (USD) |
|---|---|---|
| Storage | 5.1 GB × $0.35 | $1.78 |
| Compute | 0.5 CU × 608.75 h ≈ 304.38 CU-hr × $0.22 | $67.57 |
| Estimated total | at ~0.5 CU during 608.75 h active | $69.35 |
Supabase— Pro + Large detail
Back to comparison
Supabase— Pro + Large detailFor this benchmark’s ~5.1 GB Postgres data, Supabase’s dashboard reported ~3.86 GB WAL and ~1.51 GB system overhead (~10.47 GB on disk total). That exceeds the Pro plan’s 8 GB included disk, so the project was resized to a custom 12 GB disk. The database alone exceeds the Medium compute tier (4 GB RAM) — Large(8 GB RAM, 2-core ARM) holds the working set in memory. Unlike Neon, the instance stays provisioned 24/7; Supabase’s calculator bills a flat monthly compute add-on.
| Assumption | Value |
|---|---|
| Plan | Pro (8 GB disk included; daily backups, bandwidth pool) |
| On-disk breakdown | Database 5.1 GB + WAL 3.86 GB + system 1.51 GB ≈ 10.47 GB → custom 12 GB disk size |
| Compute | Large — 8 GB RAM, 2-core ARM ($0.15/hr listed in dashboard) |
| Line item | Supabase pricing calculator | Monthly (USD) |
|---|---|---|
| Plan subscription | Pro | $25.00 |
| Compute add-on | Large (Project 1) | $110.00 |
| Compute credits | Included with Pro | −$10.00 |
| Estimated total | Pro + Large − credits | $125.00 |